Back
Educational
9 Metrics to Measure Newsletter Growth

Sophie
Marketing Consultant

Email newsletters remain one of the most reliable and cost-effective marketing tools out there. According to the Direct Marketing Association, email marketing delivers an average return of $25.80 for every dollar spent. Some companies even report that newsletters drive more than half of their total revenue.
But how do you know whether your newsletter is working?
It’s not just about crafting great content or using eye-catching subject lines. Measuring your newsletter’s performance requires tracking specific metrics that give you a clear view of what’s resonating with your audience and what’s not.
Below, we’ll walk you through the 9 most important newsletter performance metrics every marketer should track.
1. Bounce Rate
Bounce rate shows the percentage of emails that were not successfully delivered to your subscribers.
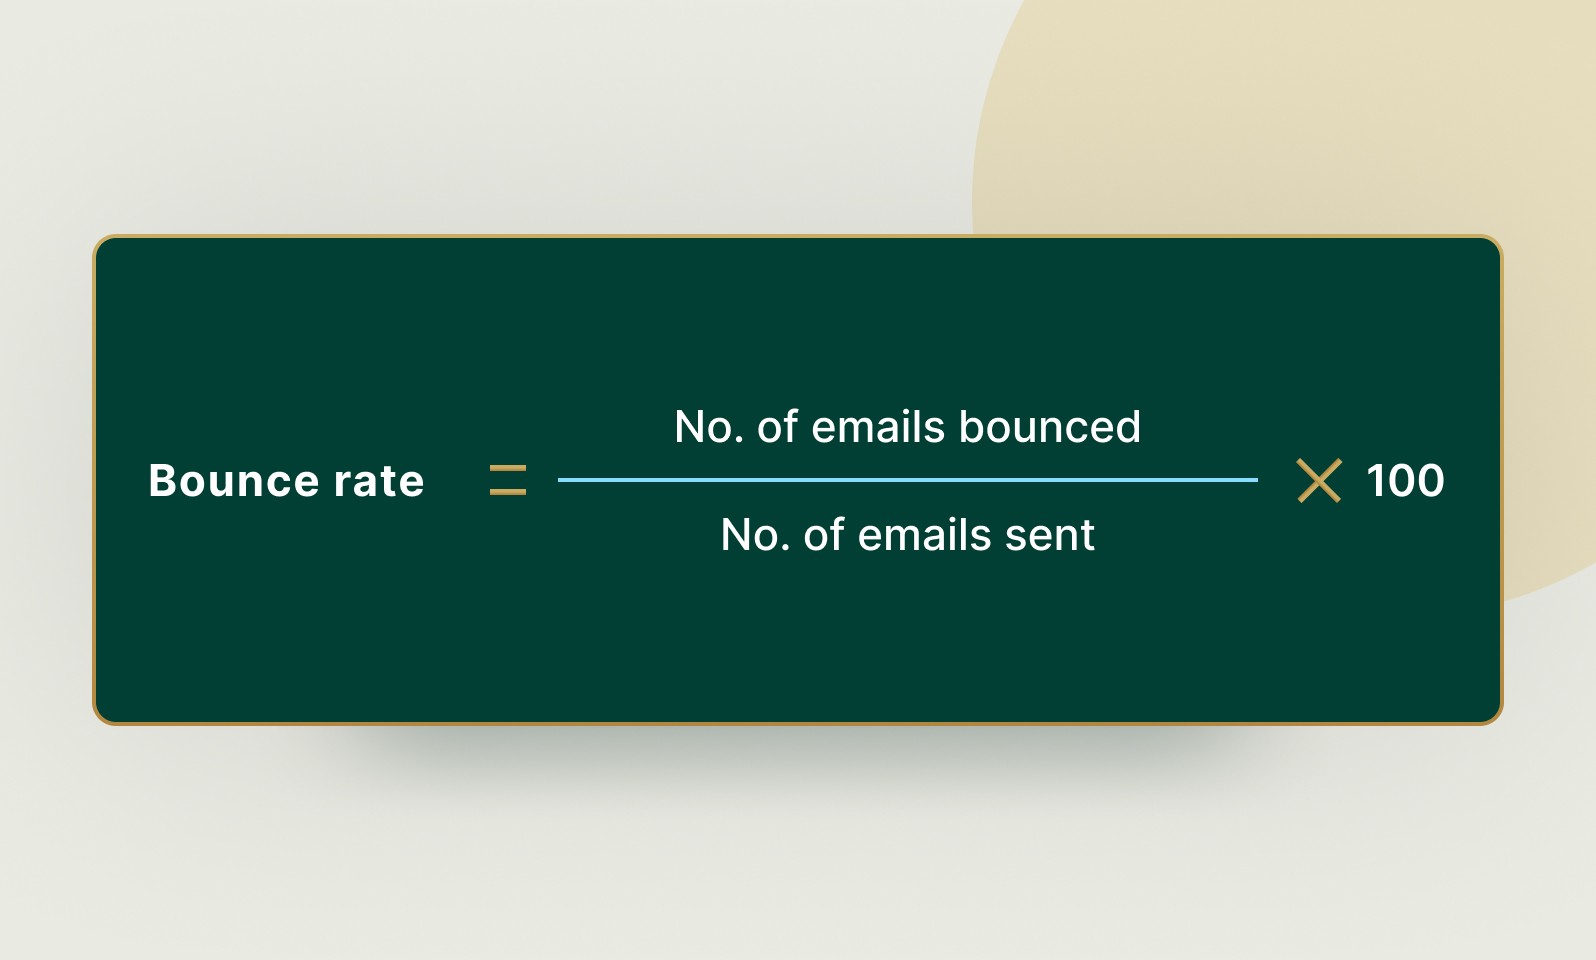
There are two types of bounces:
Hard bounces happen when an email address is invalid or no longer in use.
Soft bounces are temporary issues, like a full inbox or server downtime.
A high bounce rate can damage your sender reputation and reduce the chances of your emails landing in the inbox. Regularly clean your email list using tools like ZeroBounce or XVerify to keep this number low.
Why it matters: A high bounce rate indicates poor list hygiene and can reduce your email deliverability.
2. Delivery Rate
Your delivery rate is the percentage of emails that were successfully delivered to inboxes.
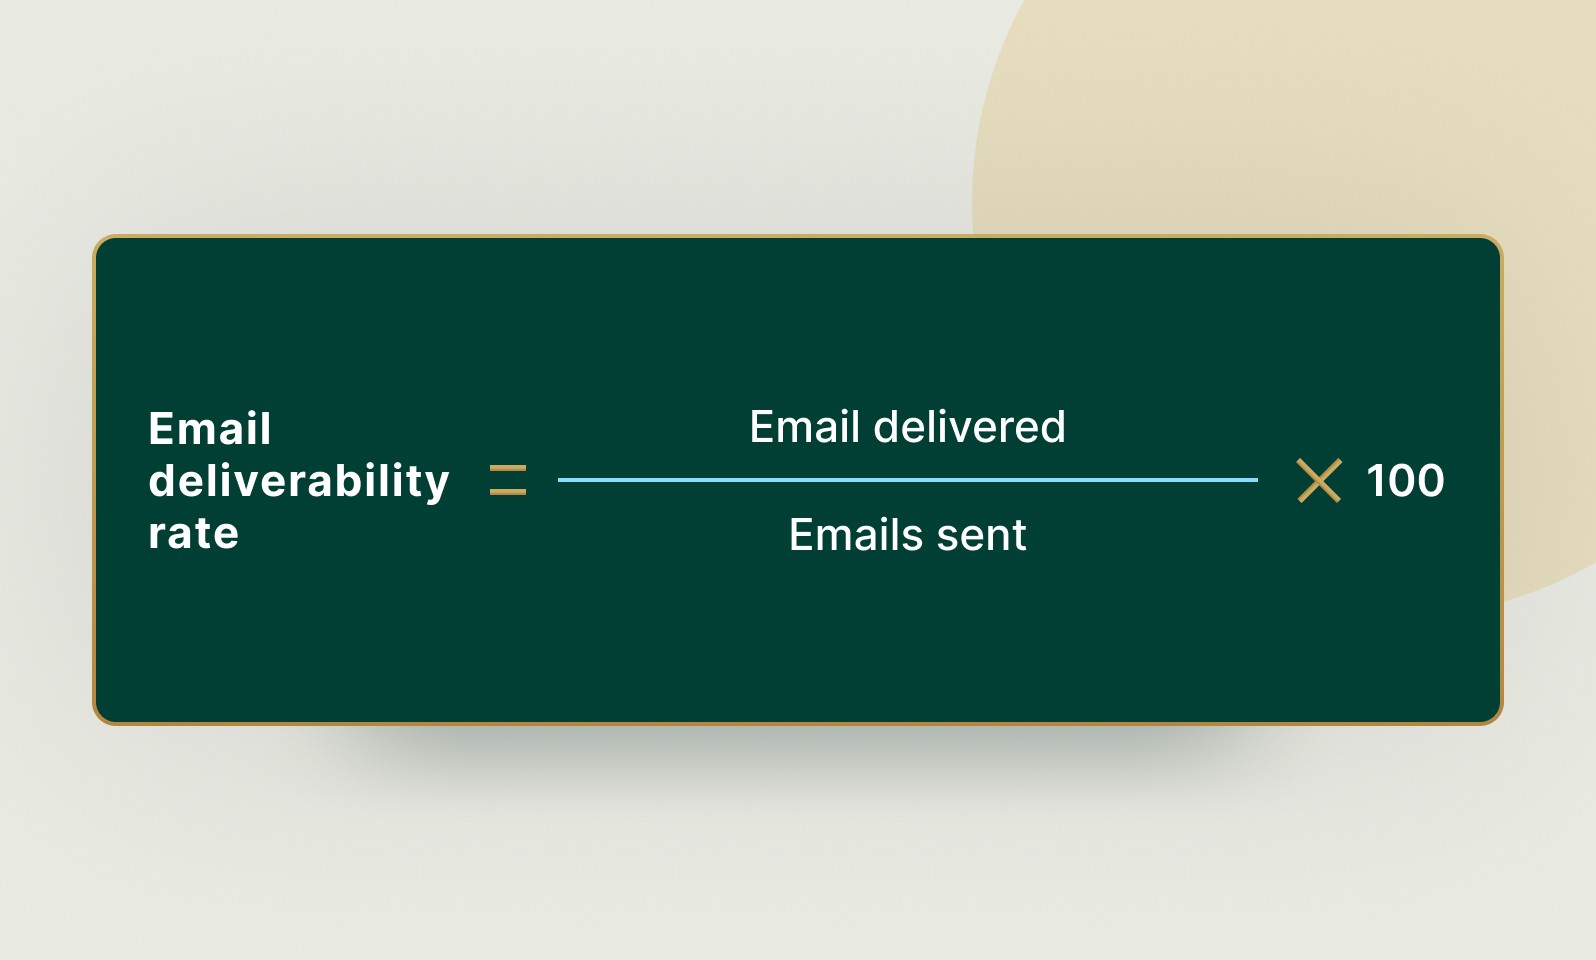
While many email platforms calculate this automatically, it’s important to monitor. A healthy delivery rate is typically above 95%. If it drops, your sender score may be low, or your emails may be flagged as spam.
Why it matters: Even the best content can’t work if it never reaches the recipient.
3. Spam Complaint Rate
This measures how many recipients marked your email as spam. Unfortunately, it can happen even if people opted in to receive your emails.
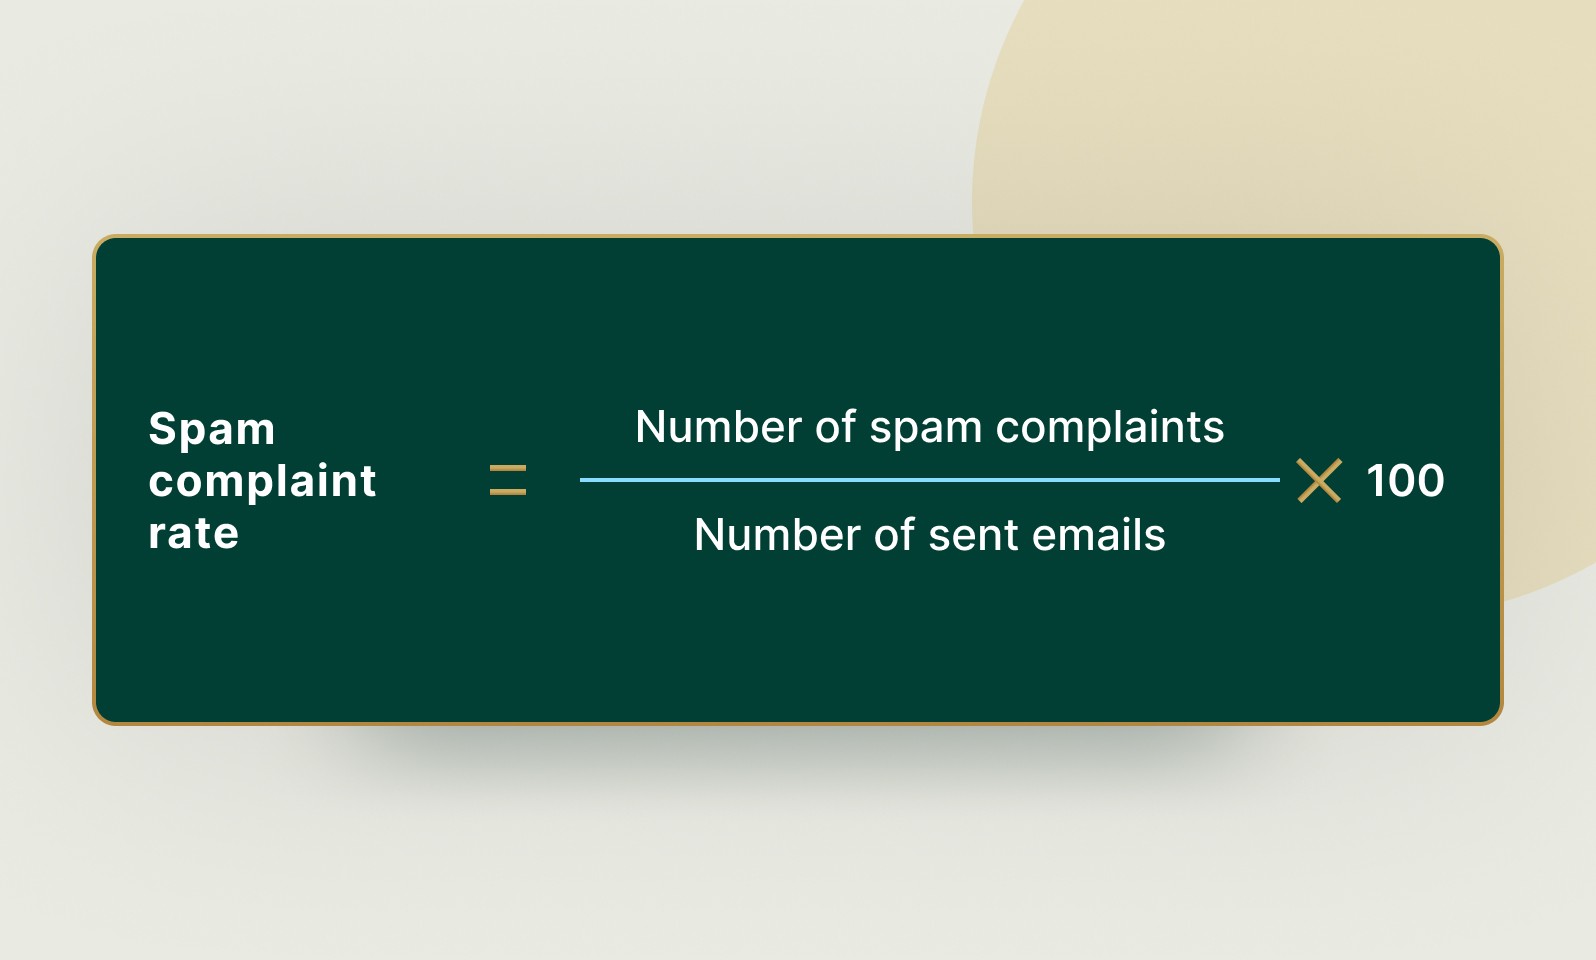
Most platforms like Mailchimp and ConvertKit track this metric. A good complaint rate is under 0.1%. If you’re seeing more than that, your content or frequency might be off.
To reduce spam complaints:
Use double opt-ins
Be clear about what subscribers can expect
Avoid over-emailing
Why it matters: High complaint rates can get your email address blacklisted.
4. Open Rate
Open rate tells you how many people opened your email.
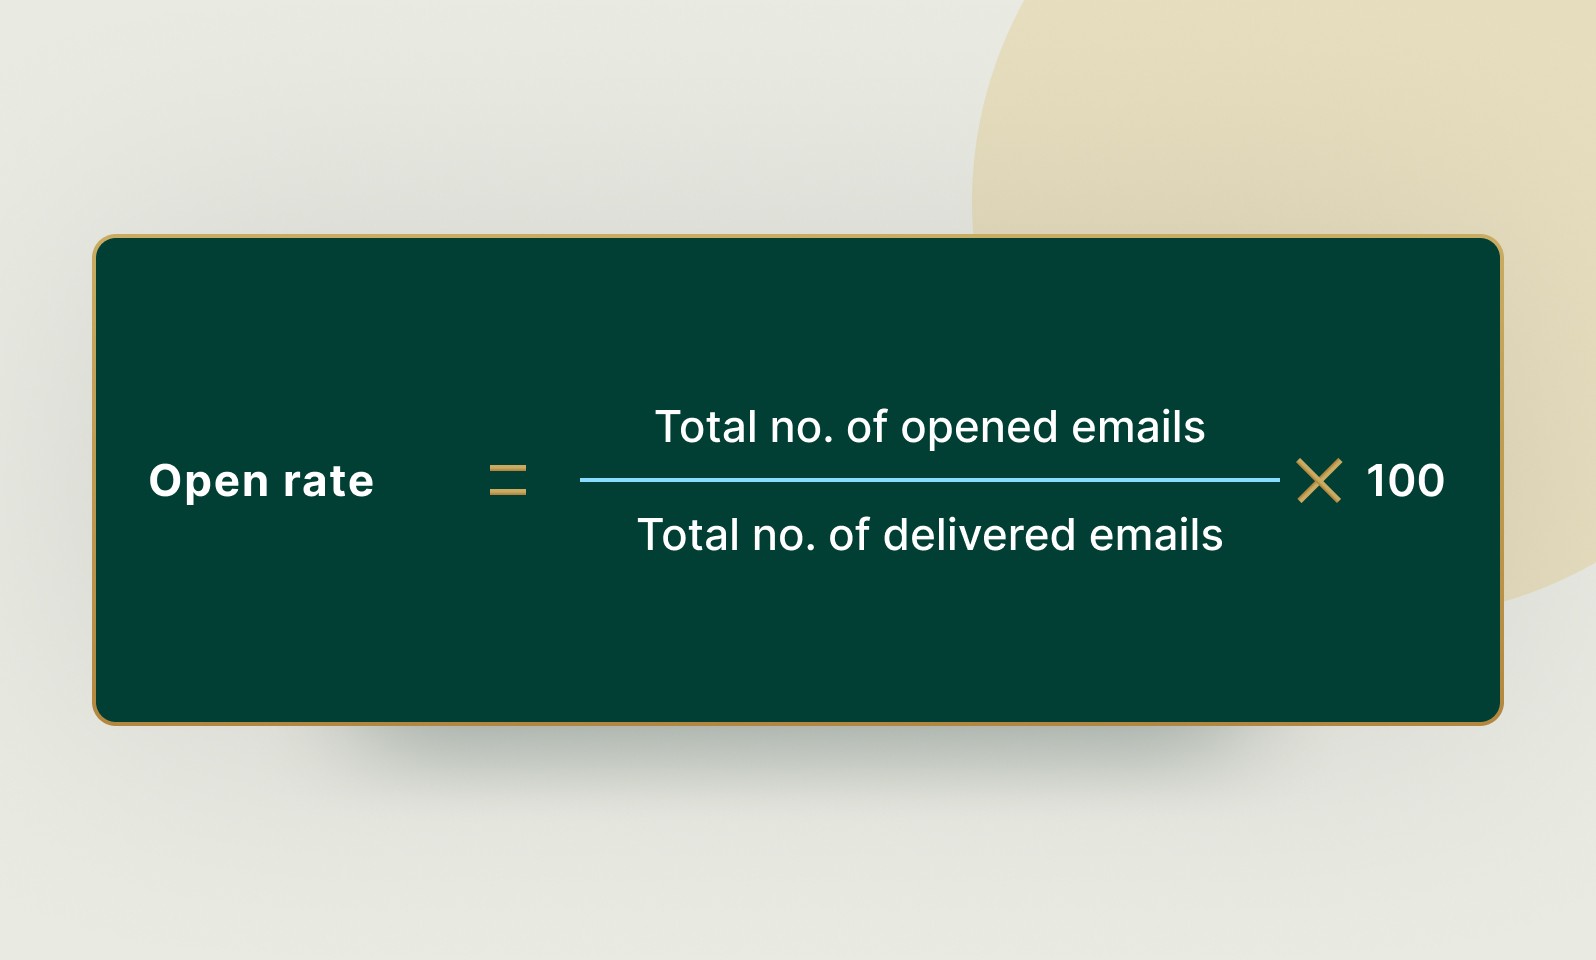
While this metric is widely used, it’s not always accurate. Email clients like Apple Mail use privacy protections that block tracking pixels, which can prevent your platform from recording opens.
Still, it’s useful for A/B testing subject lines, sending times, and preview text.
Why it matters: Open rate offers a directional view of how compelling your subject lines and timing are.
5. Click-Through Rate (CTR)
CTR shows the percentage of recipients who clicked on at least one link in your email.
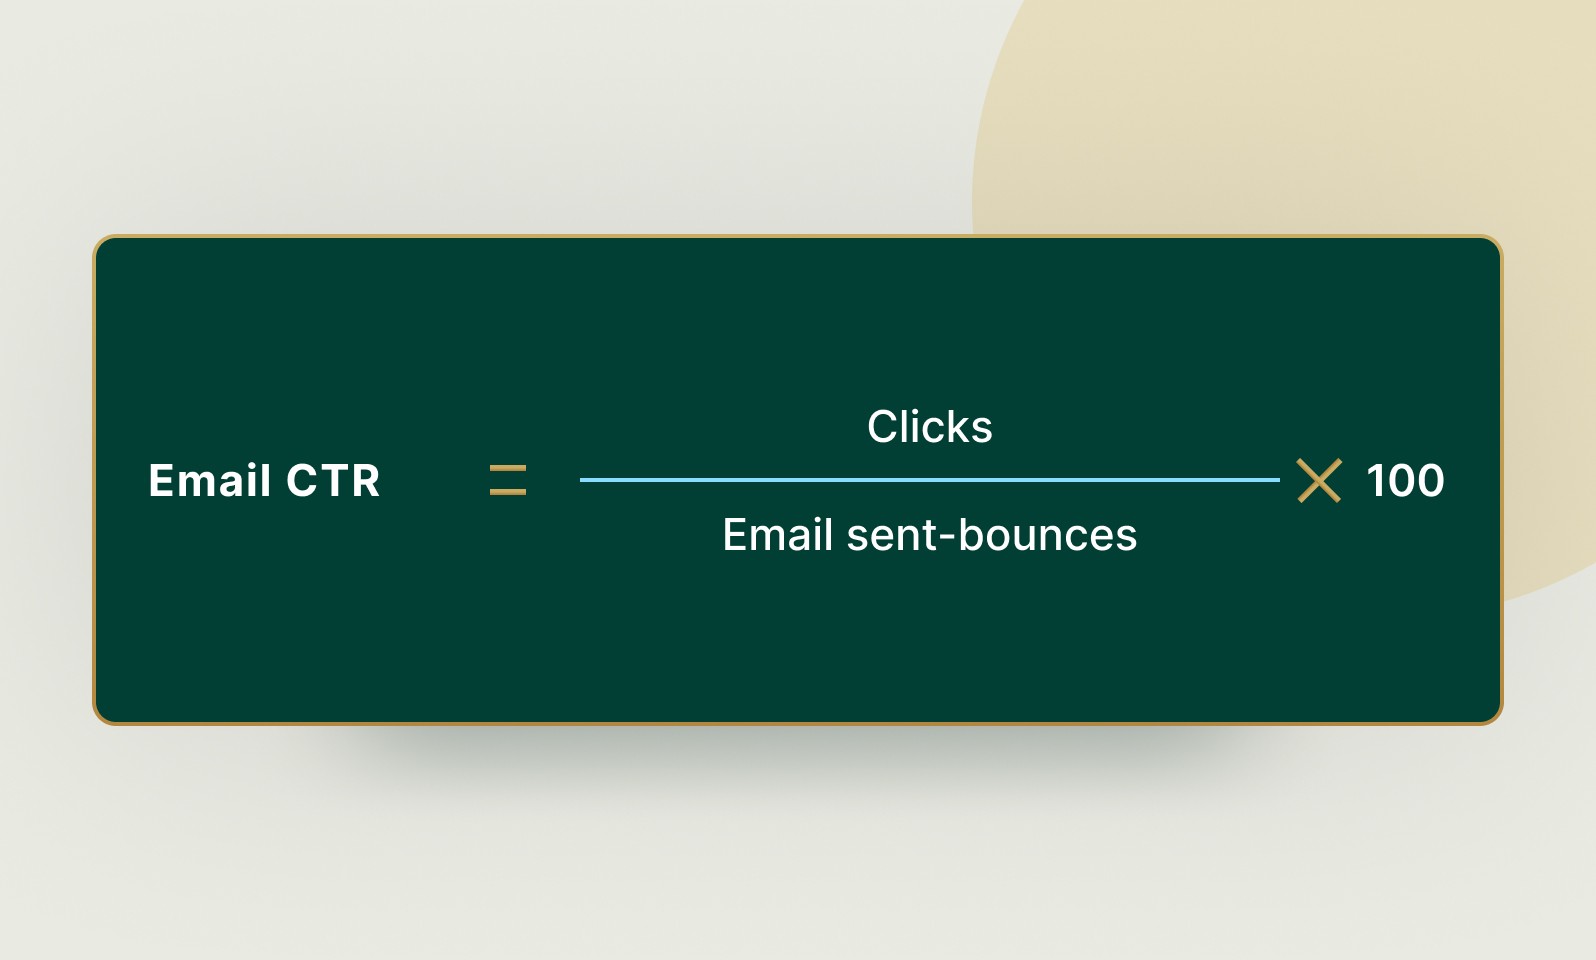
If 1,000 people receive your email and 50 of them click a link, your CTR is 5%.
Some marketers prefer Unique CTR, which counts each person only once, even if they click multiple times. This gives a more accurate view of how many individuals are actually engaging.
To improve CTR:
Write strong, clear calls to action
Personalize your content
Test different placements for your links
Why it matters: CTR reflects real engagement beyond just opening an email.
6. List Growth Rate
Your list growth rate measures how many new subscribers you’re gaining compared to those you’re losing.
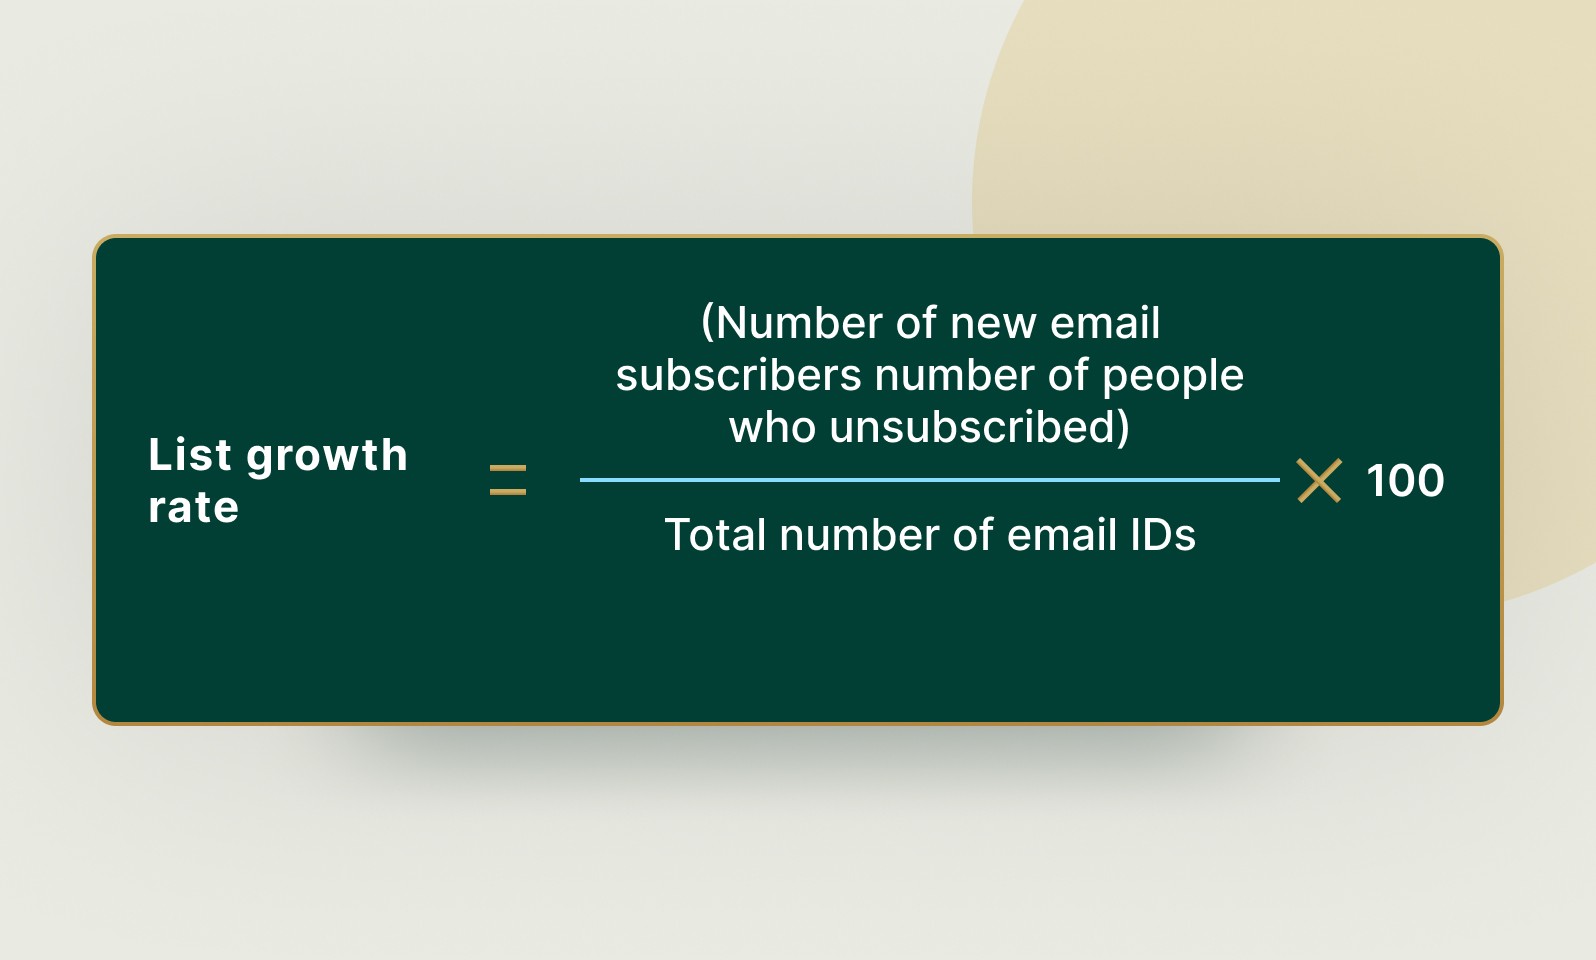
People naturally unsubscribe or abandon their email addresses over time, so you need constant growth to maintain your reach. Promote your newsletter across different channels like your blog, social media, and product pages to keep your list expanding.
Why it matters: A shrinking list is a sign your strategy may be off or your content isn’t delivering enough value.
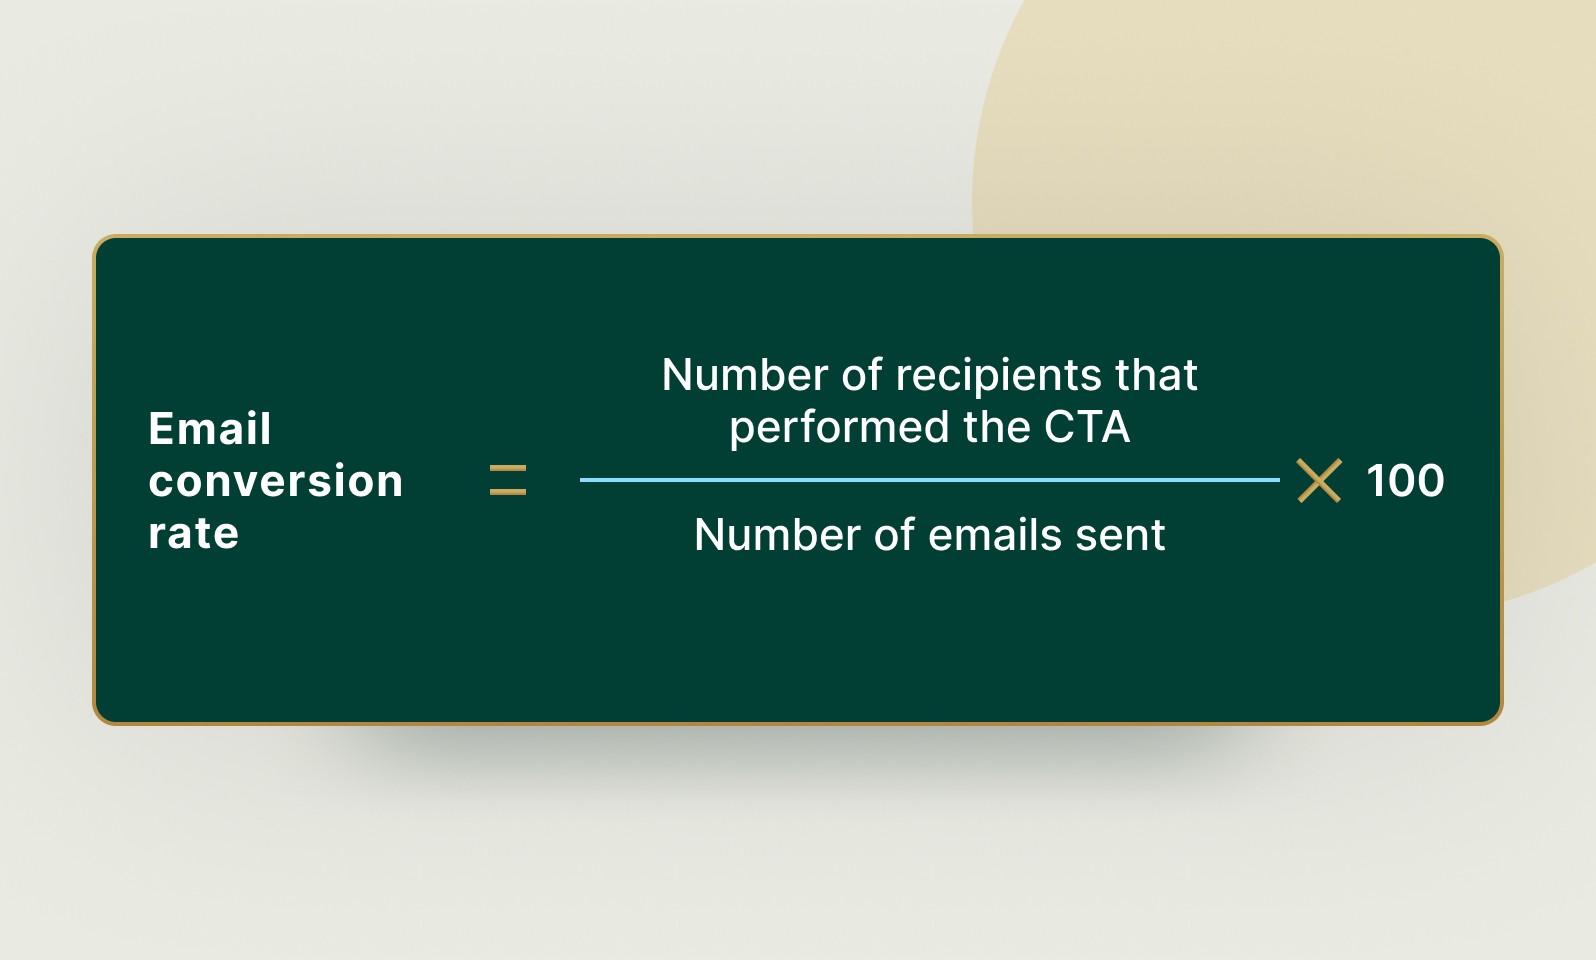
7. Conversion Rate
This metric tracks how many recipients take a desired action after clicking your email. A conversion could be a purchase, form submission, or demo request.
Use tools like Google Analytics or HubSpot to track these actions through custom events or tagged URLs.
Your newsletter should always include a goal, even if it’s just reading a blog post. If you’re not seeing conversions, revisit your landing pages and calls to action.
Why it matters: Conversion rate connects email engagement with business outcomes.
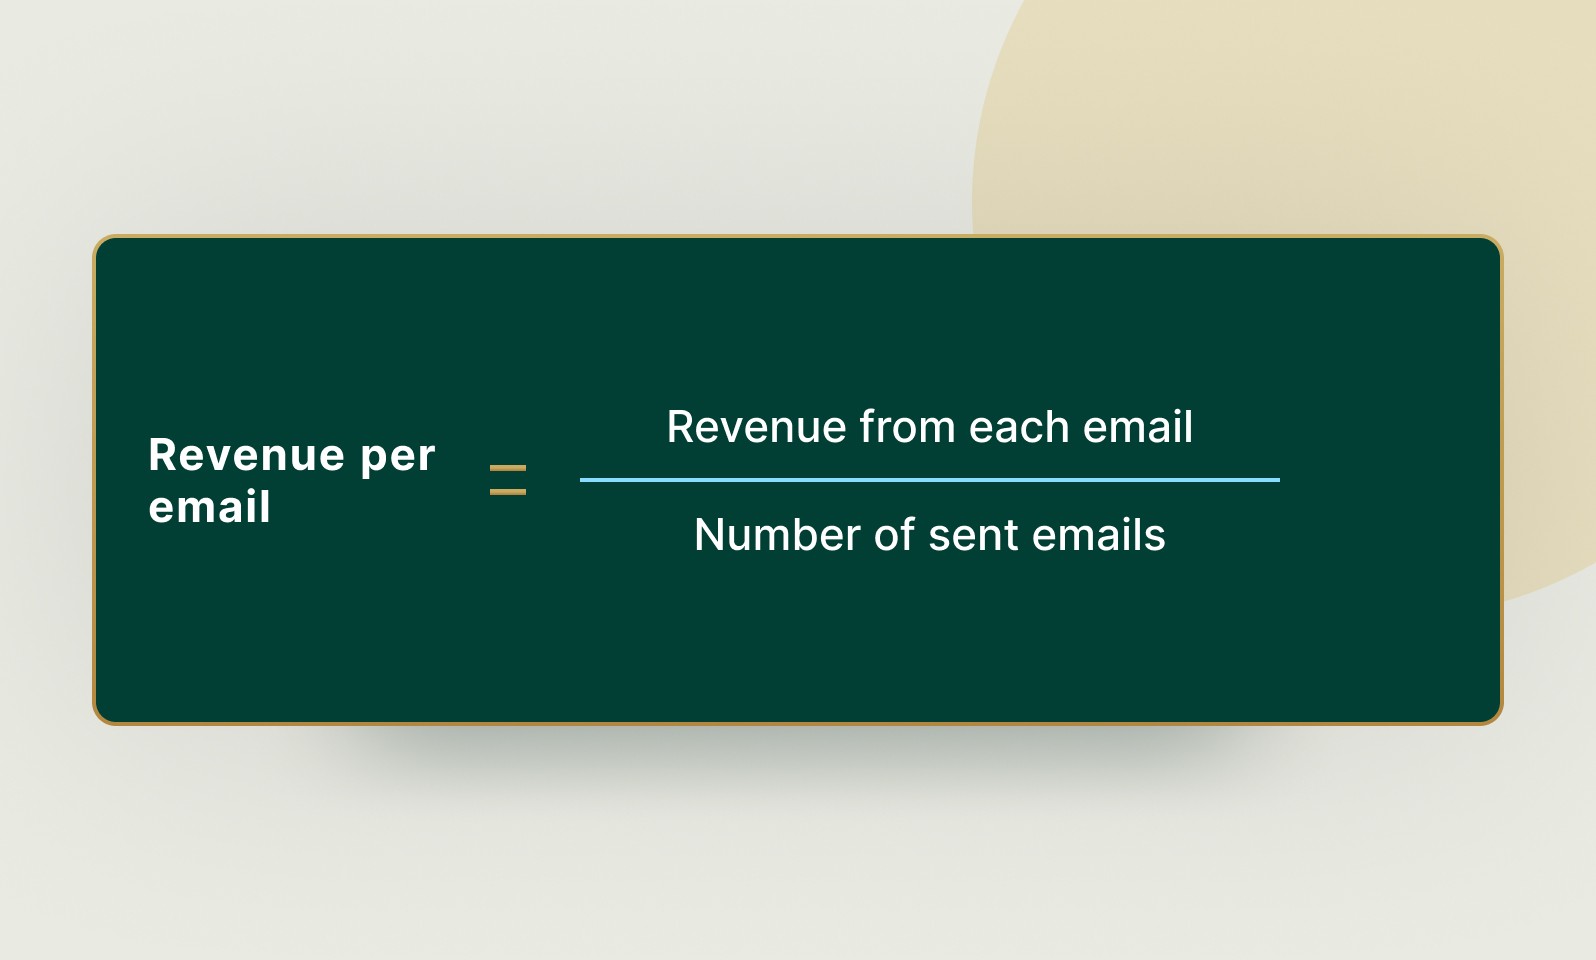
8. Revenue per Email
This is especially relevant for eCommerce brands. Revenue per email shows how much money you generate on average from each email sent.
It’s a powerful metric when you can directly tie purchases back to a campaign. Even if your CTR is low, if those clicks lead to high-value conversions, your campaign can still be a success.
Why it matters: It’s one of the clearest ways to tie your newsletter to ROI.
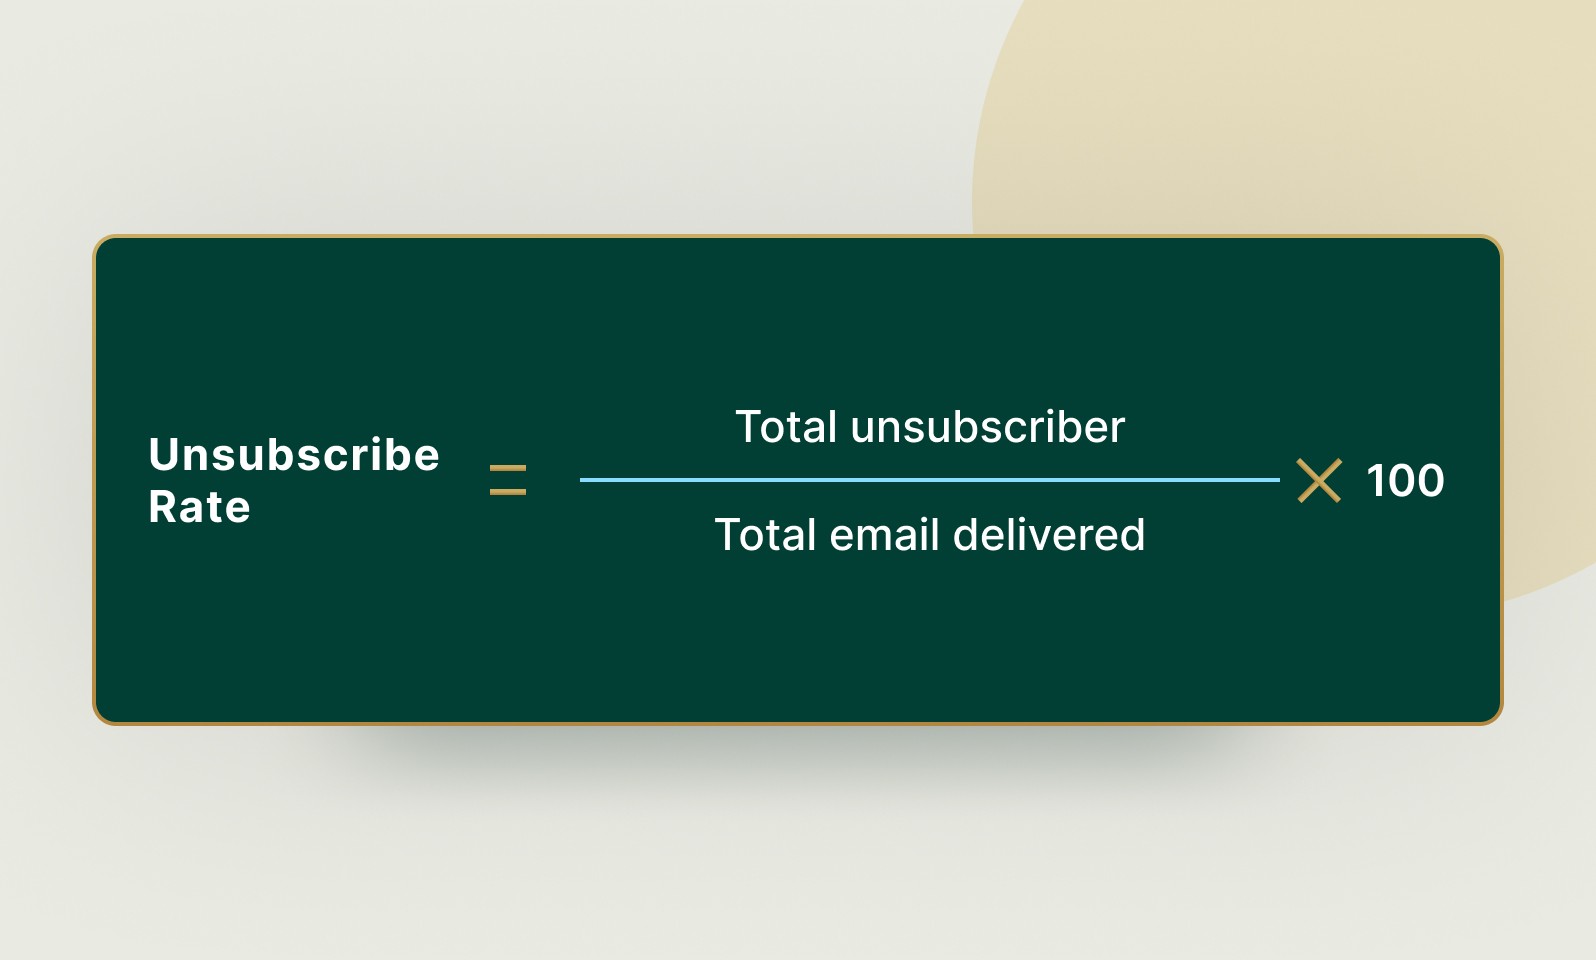
9. Unsubscribe Rate
Unsubscribe rate shows the percentage of people who chose to leave your list after receiving an email.
A small number of unsubscribes is natural. But if this rate spikes, it could be due to:
Too many emails
Poor content quality
Lack of relevance
A typical unsubscribe rate is below 0.5%. Anything above 1% should prompt a review of your email frequency and content strategy.
Why it matters: Unsubscribes provide insight into what your audience doesn’t want.
Final Thoughts
Tracking the right email newsletter metrics can turn your campaigns from guesswork into a finely tuned strategy.
By keeping a close eye on these 9 performance indicators you can understand what’s working and where to improve.
Remember, the goal of email newsletters isn’t just to send content but to connect with your audience, build trust, and drive action.
Make it a habit to review these metrics regularly and use the insights to shape a better newsletter strategy.

